


.jpg")


Map: How much leverage do buyers have in your NYC neighborhood?
After a years-long sprint of a seller's market, the tides have started to turn in New York real estate, with an increasing amount of negotiability for buyers—as well as a notable increase in concessions.
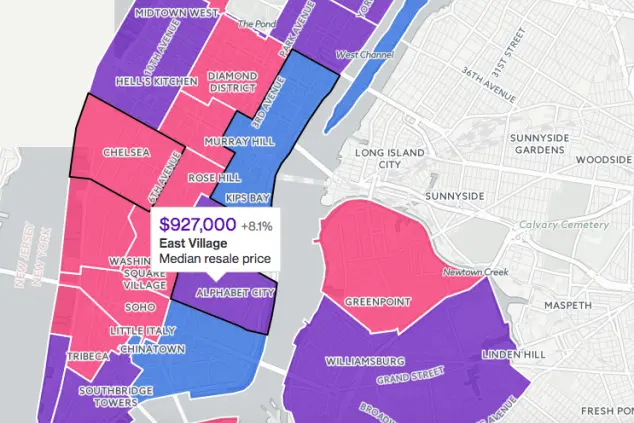
But as with all things real estate-related, location is the key factor, and how much of an upper hand you might have as a buyer—not to mention what kind of return you can expect to get on your investment—will depend heavily on where, exactly, you plan to purchase. In an effort to somewhat demystify the rent-versus-buy question, Bloomberg has teamed up with StreetEasy to create an interactive neighborhood map of Manhattan and Brooklyn; it shows median prices, change in prices from last year, and the so-called "tipping point" that represents that time it would take for the costs of renting to outweigh the costs of purchasing.
For instance, in Alphabet City where values are rapidly on the rise, you'd recoup your upfront costs in less than four years, but in already-pricey Soho and Chelsea, it would take more than 8.4 years for buying to ultimately pay off: (click to enlarge)

The map is set to be updated every three months based on StreetEasy quarterly data, and as the market continues to cool, will also track what kind of discounts buyers are getting in a given neighborhood. (Perhaps unsurprisingly, Manhattan's biggest discounts are currently in Midtown, where there's a glut of luxury inventory competing for attention and the current median discount is 8.3 percent off the initial asking price, according to Bloomberg.)
Elsewhere, on both the Upper West Side and Upper East Side, more than 40 percent of listings saw some kind of price cut, but the trend didn't extend to Brooklyn, where Williamsburg listings saw on average a 1.5 percent increase on the original asking price. “There are a lot of neighborhoods in Brooklyn that are really popular right now, and they favor sellers relative to buyers,” StreetEasy senior economist Grant Long told Bloomberg.
While the data from some neighborhoods might be discouraging, for would-be buyers and investors, this is a helpful extra layer of information to help you determine what your property values might be in a few years—and whether or not you can negotiate with the seller on your next deal. Check out the full map on Bloomberg.
You Might Also Like


