Manhattan median rent hit $4,700 in July, the fifth record in six months
- A record share of new Manhattan leases involved a bidding war last month
- Queens median rent rose to $3,750 in July, just $100 less than Brooklyn
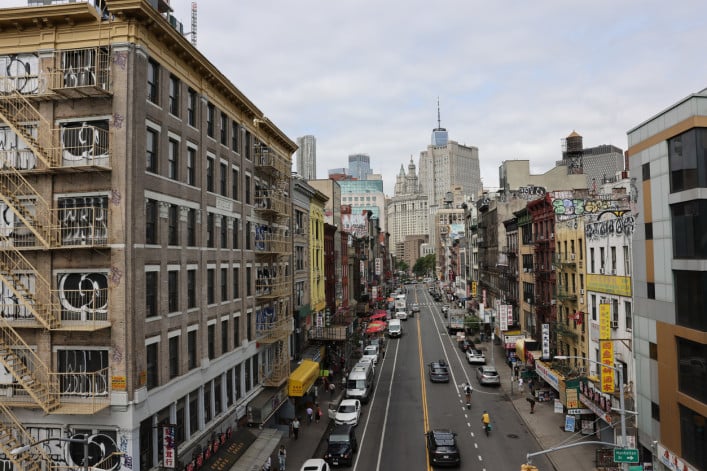
Manhattan's market share of bidding wars reached a record high of 28.9 percent, the highest since tracking by the Elliman Report began in February 2021.
iStock
Each month, rents for new leases in New York City are setting new annual records, or coming close to new records, reflecting a highly competitive rental market.
In Manhattan, median rent rose to a new high for the fifth time in six months, according to the latest edition of the Elliman Report for the Manhattan, Brooklyn, and Queens rental markets. July saw Manhattan’s median rent hit $4,700, an increase of 9.3 percent from a year ago, the report said.
The share of bidding wars for Manhattan rentals reached a record high of 28.9 percent, "the highest since recording began in February 2021," said Jonathan Miller, president and CEO of appraisal firm Miller Samuel and author of the report.
The number of leases signed last month in Manhattan dipped slightly by 1.7 percent annually, and listings were down half a percentage point compared to the prior year.
In Brooklyn, median rent rose to the second-highest on record: climbing 6.9 percent to $3,850.
The number of new signed leases was down 3.5 percent and listing fell 6.8 percent compared to July 2024.
For Queens, median rent has posted large annual gains each month this year, as per the Elliman Report. Median rent increased 8.7 percent last month to $3,750 compared to a year ago—just $100 less than Brooklyn.
New lease signings increased annually for the third time in four months: The number of new signed leases was down 6.9 percent. Listing inventory has risen year over year for 18 months and was up 10.4 percent in July, the report said.
FARE Act impacts pricing
Corcoran also released July rental market reports for Manhattan and Brooklyn.
Gary Malin, Corcoran’s COO, noted that the new broker fee law is impacting the market.
“The recent FARE Act has already influenced landlord’s pricing and marketing strategies, while adding a new layer of complexity to an already fast-moving market—especially when you factor in that significant numbers of apartments are available but are not being publicly advertised,” Malin said. “Today’s renters are facing a landscape where speed, flexibility, and informed decision-making are more critical than ever.”
NYC neighborhoods with the largest increases in rental inventory
Neighborhood | Borough | Change in inventory | Change in asking rent |
Gowanus | Brooklyn | 392 (+144%) | $4,875 (+25%) |
Inwood | Manhattan | 220 (+91%) | $3,153 (+43%) |
Fort Greene | Brooklyn | 417 (+68%) | $4,500 (+12%) |
Boerum Hill | Brooklyn | 249 (+58%) | $4,800 (+11%) |
Jamaica | Queens | 244 (+44%) | $2,915 (-4%) |
Downtown Brooklyn | Brooklyn | 679 (+28%) | $4,531 (+1%) |
Midwood | Brooklyn | 263 (+22%) | $2,980 (+7%) |
Prospect Heights | Brooklyn | 239 (+14%) | $4,460 (+2%) |
Flatbush | Brooklyn | 984 (+9%) | $3,100 (+2%) |
Long Island City | Queens | 1276 (+3%) | $4,500 (+5%) |
Source: StreetEasy
Where renters can find the most options
StreetEasy also released its July Market Report, which highlights the 10 neighborhoods where rental inventory has grown the most since last year.
Citywide rental inventory rose at more than double the historical pace from June to July, but is down 7.7 percent year-over-year. The citywide decline is largely because of Manhattan, which saw its 16th consecutive month of inventory decline.
You Might Also Like


