Report: New development drags down prices in a 'polarized' Manhattan real estate market
New development saw an "unusually low" quarter with 157 sales.
iStock
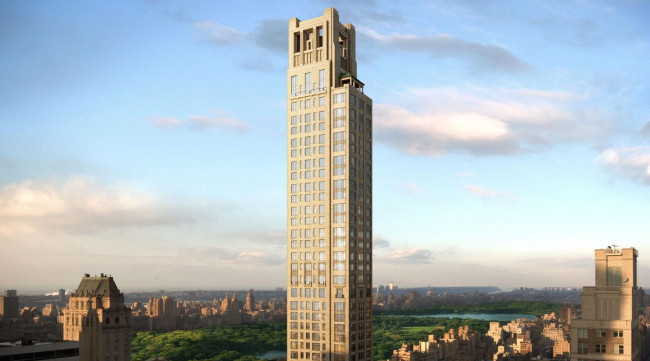
The $238 million sale of a Central Park penthouse skewed upward the average sales price of Manhattan co-ops and condos in the first quarter of 2019 by 5.8 percent. That eye-popping sale is of course an outlier, because a serious slowdown remains in effect for the New York City real estate market, especially for new development sales, according to Douglas Elliman’s first quarter Manhattan Market Report.
Overall, the number of sales slipped year over year and inventory rose for the sixth consecutive quarter, according to the report. In fact, the number of first quarter sales hit the lowest level in a decade. There were 2,121 sales in the first quarter of 2019, a 2.7 percent decline from the first quarter of 2018.
The median sales price slipped slightly by 0.2 percent to $1,075,000. However, if you break out resales, you see a different story: The median resale price rose to a new record, $997,750, increasing for the eighth consecutive quarter. (Resales are now 93 percent of the market.) The fact there's still a slight decline in the median sales price indicates just how stagnant new development is.
“The overall price declines we are observing are a function of new development, with closings down to their lowest in over four years,” says Steven James, CEO of New York City for Douglas Elliman.
Jonathan Miller, president of appraisal company Miller Samuel, and the author of the report, characterized the NYC real estate market as “polarized.”
“New development has been slowing significantly over the last year while resales moved sideways,” he says. There were 157 new development sales in the first quarter, an "unusually low" number, he says, a drop of 39.4 percent year over year to the lowest point in 4.5 years, “the lowest we have ever recorded since the first quarter of 2003,” Miller says.
While the numbers appear dramatic, Miller says, “I’m not going to over-hype them” because lawmakers in Albany appear to have hammered out a budget that includes a one-time scaled mansion tax, as opposed to an annual pied-à-terre tax, "which is far less Draconian" for buyers, he says.
New development market trends
The market share of new development has been trending downward with the sell-off of legacy contracts, or contracts that have been in the pipeline. In 2018, new development averaged about 16 percent share of the market. For context, Miller notes, new development used to make up 50 percent of the market in 2006. It goes to show how much more broad, in terms of price points, new development used to be: Today it represents more of the high end of the market, Miller says.
Two segments of the market saw increases in the number of sales: Year over year, sales rose for apartment priced $20 million and above (there were 22 sales, compared to 8 last year), as well as in the $1 million to $2 million segment of the market.
The percentage of transactions with bidding wars was almost unchanged at 7.1 percent. (For comparison, in the first quarter of 2009, when the market was a “black hole,” Miller says, bidding wars were at 6.2 percent.)
The average amount paid over asking in a bidding war was 4.1 percent, compared to 4.2 percent a year ago.
In other market reports
In Halstead's first quarter 2019 market report, Diane M. Ramirez, chairman and CEO, says, “sellers are getting real with their pricing and buyers are showing less hesitancy because of lower interest rates and a better understanding of where they stand in regard to tax reform.”
The Halstead report notes that a surge in luxury new development pushed the average price 25 percent higher. Thanks to sales at 520 Park Avenue and 220 Central Park South, new development prices averaged a record $4,945,417 in the first quarter. However, the median sales price fell 5 percent, indicating how “abnormally high these closings are.”
Stribling & Associates’ first quarter Manhattan market report found apartments are sitting on the market longer: 161 days, a 52 percent increase from a year ago and the market-wide average discount from the initial asking price was 9 percent.
Bond New York’s first-quarter market report notes supply is up 12.3 percent compared to this time last year. “What started in 2017, as a softening of the luxury market has moved through the rest of the market,” says Noah Freedman, partner at Bond New York.
Writing for Warburg’s first quarter 2109 market report in Forbes, CEO Frederick Peters, says, “The softest piece remains in the middle. Five-, six-, and seven-room apartments on both the Upper East and Upper West Sides linger on the market, only to sell for a price lower than the seller had paid for them five years earlier.”
In Corcoran’s Manhattan market report, Pamela Liebman, CEO, points out that the nearly $240 million record sale at 220 Central Park South, plus more than 20 sales above $20 million, drove the average price 11 percent higher year over year. “This quarter’s average price and average price per square foot were the second highest ever seen in Manhattan,” she says.
You Might Also Like

