


Sobering map shows how many people have been shot in your neighborhood this year
We've seen maps charting almost every quality of life factor in NYC neighborhoods, from median incomes to rodent infestations to 311 Halloween complaints, but we've never before seen one quite like this: a map plotting the number of deaths and injuries by gunshot is now up on Slate shows that gun injuries and deaths are happening all over the country and in all sorts of neighborhoods, and frequently in our own backyards. And they're not just due to mass shootings, either, though there have been a number of them in the news lately.
According to Slate, "In 2013, the most recent year for which government statistics are available, less than 2 percent of more than 33,000 gun deaths in the country were due to mass shootings. Tallies of gun-related fatalities are in turn dwarfed by totals for gun injuries. Every 12 months, more than 130,000 people are shot."
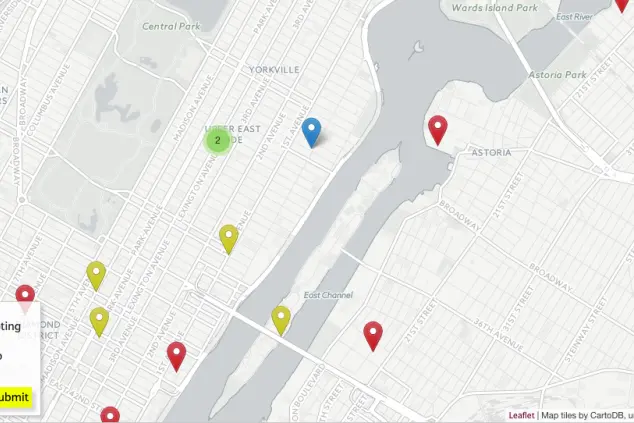
The map allows you to input your address and see how many shootings have happened so far this year near you.
The data comes from nonprofit, nonpartisan Gun Violence Archive. Interestingly—and unfortunately unsurprisingly—the pins that represent both fatal and nonfatal shootings on the map tend to get denser as you zoom in on inner cities. Some NYC findings: In the tony 10028 zip code in the East 80s on the Upper East Side, there have been seven shootings within a mile of the area in the past year; in Soho's 10012, there have been four within a mile. In the 11222, which covers Greenpoint and parts of Williamsburg, there have been five, though all were non-fatal. Bushwick's 11221 had 32—nine of them fatal.
Slate plans to update the map to include details such as the ages and genders of those shot, as well as economic and demographic info. And every three months they'll refresh the data set.
Related:
7 maps you'll want to consult before you move
Track income, crime, rents and more with the NYC data map to end all data maps
Air rights map lets you know if developers may be headed for your neighborhood
Work in the Financial District? 5 great neighborhoods with a quick commute
New map lets you scope out your neighborhood's Airbnb situation


