


Map: These are the trees in your neighborhood
On the heels of a report showing that a neighborhood's tree situation is strongly correlated to income levels (more green leads to more green, as a rule), Brooklyn web developer Jill Hubley has made a handy map of New York's tree density and species breakdown, neighborhood by neighborhood and block by block. Useful for geeking out over your street's preponderance of Norway Maples or when looking for another metric by which to keep up with the Joneses.
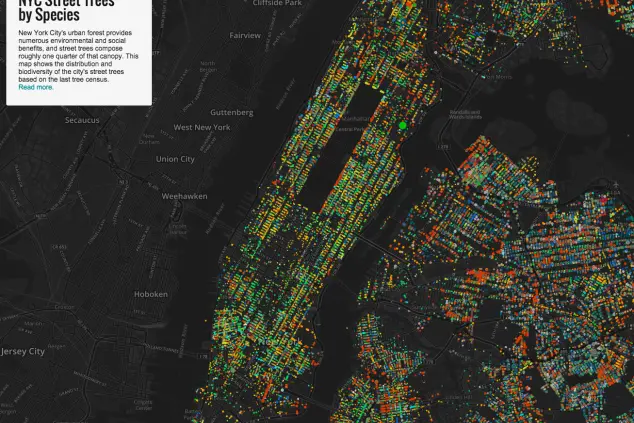
The map is based on data from the 2005-2006 Street Tree census, City Lab reports, and doesn't include trees in parks or on private property. A few surprising findings? While Queens and Brooklyn have relatively a high number of trees, Manhattan is by far the most tree-dense borough, averaging 50 trees for each mile of sidewalk. Tree type also varies widely by borough— Brooklyn's full of London Plane trees, for instance, and Manhattan is chock-a-block with Honeylocusts.
One uplifting thing to consider as you poke around the full map: Hubley tells City Lab that thanks to the Million Trees Initiative, the number of street trees in NYC jumped 19 percent between 1995 and 2005, and it's likely that there has been a huge increase in the decade since the Street Tree Census, so there's probably even more greenery in the city than what's represented on this map. More honeylocusts, everyone?
Related:
In NYC, trees tell the story of wealth disparity
Solar panels on your building ? New York is now offering some serious tax breaks


