Here's how much apartment prices have risen across NYC in the last 10 years
In the last 10 years, the New York City real estate market has been on a roller coaster. There was the real estate boom of 2006, the great recession of 2008, the great comeback at the end-of-2010, the subsequent boom of 2013, and more recently, the great leveling out of 2016.
We asked Jonathan Miller, president of the appraisal firm Miller Samuel (author of Douglas Elliman market reports) for some hard data on how the average home price has changed in the past 10 years across the city. The biggest price increases, as you might have expected, were in the most ascendant of all boroughs in the past decade—Brooklyn. One borough, the Bronx, actually saw its end-of-2016 average home price fall lower than 2006.
Interestingly, Miller pointed out that the inflation rate is up 19.7 percent over the past 10 years, so boroughs like Manhattan and Brooklyn have seen their home price growth more than triple the rate of inflation; Queens has been moderate and the Bronx and Staten Island haven't kept up with the rate of inflation (more detailed numbers below).
The Agency's Off-Market Advantage
Discover off-market brownstones and apartments in your dream neighborhood that suit your needs and budget. Meet and deal with sellers before their home hits the market.


Let The Agency's off-market team give you exclusive access to apartments and brownstones in your price range and desired neighborhood that no one else has seen. More options, less competition, no bidding wars.
Note: We're focusing on condos, co-ops and one-to-three family homes here, but in case you're wondering, the rents in Manhattan have grown from an average of $3,874 in 2006 to $4,124 in 2016. There were, however, "lots of gyrations over the last 10 years," Miller points out.
Rents froze after the crash, soared about two or three years ago and then, in the last year-and-a-half or so, have leveled off. "The market has dug itself out of the bust and is moving forward," says Miller. "Rents are tepid, even though they're high."
But Miller also says it's important to realize that averages can be somewhat misleading, since they're swayed so heavily by super-expensive outliers. In other words, those $50 million-plus properties you read about ocassionally can move averages way up.
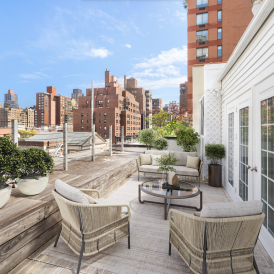
Manhattan
Average price at the end of 2006: $1,306,095
Average price at the end of 2016: $2,139,153
Change: +$833,058 (+63.8 percent)
Unsurprisingly, from the fourth quarter of 2008 until 2012, when the economy was going through its extended funk, sales were rather slow in Manhattan. Generally, prices went up, but in small increments. Things started to get a real boost in 2014. "The peak was pre-Lehman, and that threshold was not reached again until almost seven years later," says Miller.
But he adds that the higher-than-usual numbers of the last five quarters, which have risen over the $ 2 million threshold, are a result of legacy closings in super high-end developments. (They went into contract years ago, in the building's early stages, and sometimes units were sold from floorplans.) "We're running out of those legacy contracts, so you're gonna see a drop in the average in coming quarters," Miller predicted. "But it does not reflect a decline in the market."
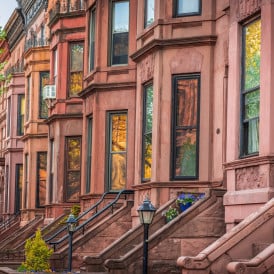
Brooklyn
Average price at the end of 2006: $563,712
Average price at the end of 2016: $947,553
Percentage change: +$383,841 (+68.1 percent)
Of all the boroughs, Brooklyjn saw the largest bump. "That had to do with the market skewing more luxury. It's not super-luxury like Manhattan, but the market essentially reinvented itself from what was formerly a cheaper alternative to Manhattan to a competitor of Manhattan," Miller says of Brooklyn's decade-long evolution.
The most consistent increases have happened since 2014. Between the first quarter and second quarter of that year, the average jumped from $681,182 to $783,296. While that settled down a bit, we've still seen prices rise and rise.
Queens
Average price at the end of 2006: $479,877
Average price at the end of 2016: $573,455
Percentage change: +$93,578 (+19.5 percent)
Things were tough for Queens from 2009 to 2013, but have picked up significantly since then. That said, the best way to describe the market over the past years is propably tepid. "Most of Queens' growth has occured in the last two years. And most of that is because of the Northwest region's luxury development (though most of that is rental). But I think the bigger issue is what I call 'Brooklyn spillover.' Brooklyn is at capacity," explains Miller.
Bronx
Average price at the end of 2006: $407,936
Average price at the end of 2016: $393,323
Percentage change: -$14,613 (-3.6 percent)
As you'll see from the numbers above, the Bronx saw a decline in its average price, but that's somewhat misleading, since the last month of 2006 was higher than any other month before or after. The first quarter of 2007, for example, saw an average price of $391,050, which would mean that the 10-year difference was +$20,000. The problem, says Miller, is that "they didn't have a luxury development boom to get them back" after the market went bust post-Lehman meltdown.
Staten Island
Average price at the end of 2006: $447,940
Average price at the end of 2016: $489,570
Percentage change: +$41,630 (+9.3 percent)
Like the other boroughs before it, Staten Island got hit by a decline in 2009. But things have begun to (conservatively) go up in price, starting in 2014. "They've been through hell and back," says Miller. "It's much more suburban, and home prices were affected during the crisis." Plus, he adds, Staten Island was the borough most affected by Superstorm Sandy at the end of 2012, and its housing market reflected that.
You Might Also Like

