


And now, a depressing map of New York's dwindling affordable housing
In case you needed further proof that the city's supply of rent-stabilized apartments has been steadily shrinking, behold, a handy interactive map of buildings that've lost stabilized units since 2007:
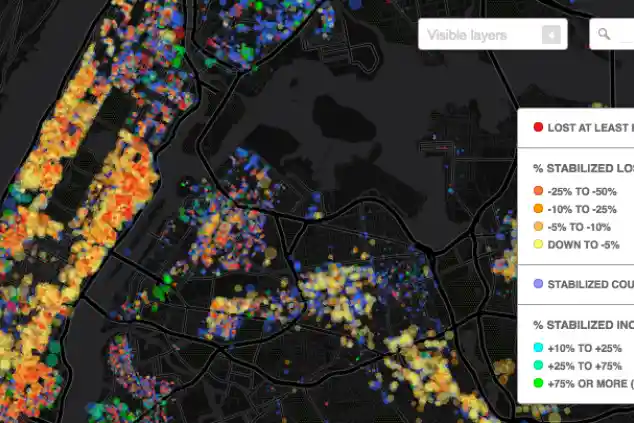
The map is the work of John Kraus (h/t Gothamist), who put the map together using open source data on tax bills. Buildings that are red have lost at least half of their stabilized units since 2007, orange means they've lost 25 to 50 percent, and so on.
As you can see, the Upper East Side and the trendier neighborhoods downtown seem to be particular hotbeds of destabilization. Once you're done upsetting yourself with Kraus' creation, can we interest you in this other scary map of NYC's future as an underwater metropolis?
Related:
Now that it's really happening, here's what you need to know about that NYU expansion
Ask Sam: How do I find out if my apartment should be rent-stabilized—and if the landlord owes me money? [sponsored]


